When we got our first crash course on Wireshark two weeks ago I was understandably overwhelmed by the sheer amount of information the tool produces. After spending some time with it, I feel slightly more comfortable, but by no means less intimidated. As a total layman to network administration, I had to climb a steep learning curve to understand even a sliver of the data Wireshark produces. That said, combing through results of 24 hours of packet sniffing did yield some fascinating insights into my home network traffic.
Protocols
Did I mention that Wireshark logs a literal ton of data? Here are the protocols it spat out from my outbound traffic (from my computer) for me to analyze:
TCP: Transmission Control Protocol. The language a computer uses to access the Internet.
QUIC: Quick UDP Internet Connections. An experimental transport layer protocol developed by Google.
TLSv1.2: Transport Layer Security. An upgraded version of SSLv3 (Secure Socket Layer)
UDP: User Datagram Protocol. An alternative to TCP used primarily for establishing low-latency and loss tolerating connections between applications on the Internet.
SSDP: Simple Service Discovery Protocol. A network protocol for advertisement and discovery of network services and presence information.
HTTP: Hyper Text Transfer Protocol. An application protocol for distributed, collaborative, and hypermedia information systems.
WebSocket: Computer communications protocol, providing sending and receiving communication channels simultaneously over a single TCP connection.
MDNS: Multicast Domain Name System. Resolves host names to IP addresses within small networks that do not include a local name server.
ICMP: Internet Control Message Protocol. Used by network devices such as routers to send error messages and operational information about request service status.
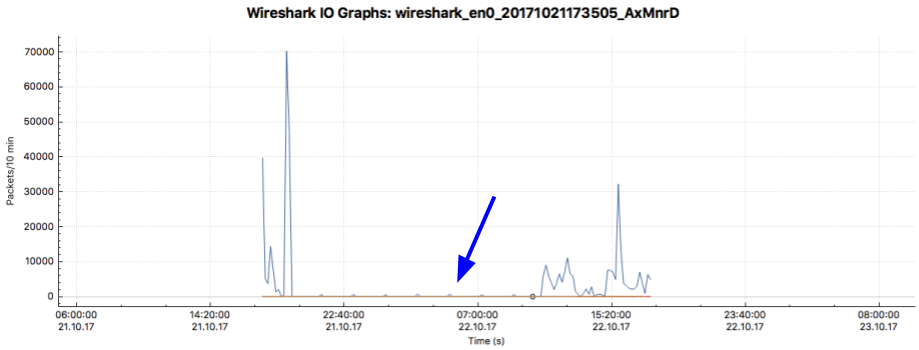
I initially ran Wireshark for a 24 hour period. I filtered the results by an interval of every 10 minutes to make the data easier to analyze. This yielded an overwhelming amount of information about my network traffic, most interestingly that there were still occasional spikes of traffic even when I was asleep and not on my computer.

While this timeframe produced more packets than was reasonable to analyze for this assignment, the period of time when I was supposedly offline did prove an interesting place to start digging into.
I was asleep by 11:30pm this day and I slept until about 9am the next morning, so any traffic observed during this time did not come from my or my girlfriend’s network activity.
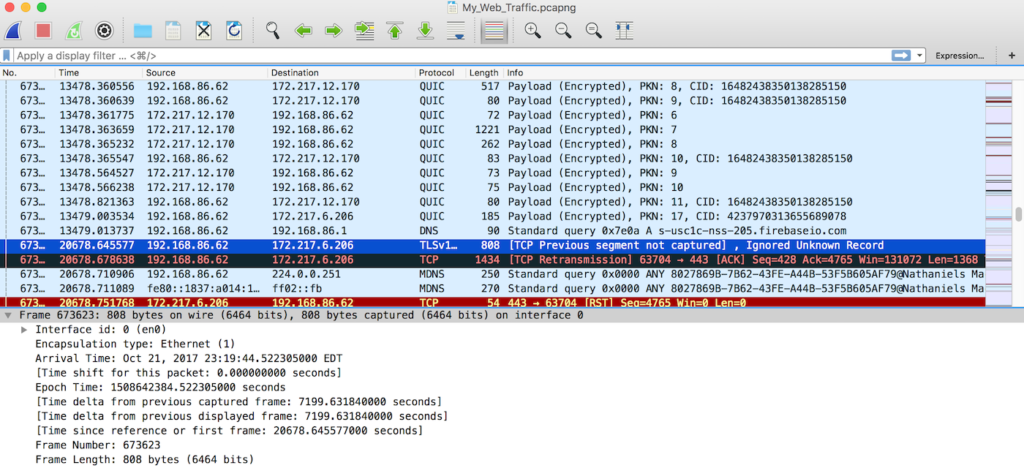
In analyzing packet data the next day, the first thing I noticed was that there was activity on my network about every two hours during this “dormant” period. The vast majority of these packets followed TCP protocol and either came from my computer (192.168.86.62) or went to it. I suspect a lot of this is cookies and other software installed in my browser and on my computer from surfing the web.

The dark blue line indicates a packet I selected in Wireshark. The black row is a TCP packet that had a problem. I’m not sure what went wrong with it, but Google tells me it could be due to the packet being delivered out of order.
The red row indicates a TCP reset, which could be my router responding to receiving a packet for a closed socket or an attempt to block traffic from a site. Typing the IP into my browser (Chrome) takes me to Google, and actually pasting that IP into Google revealed that it is actually Google owned and associated with a benign crawler. This seems to confirm my suspicion about the sources of traffic when I wasn’t on my computer.
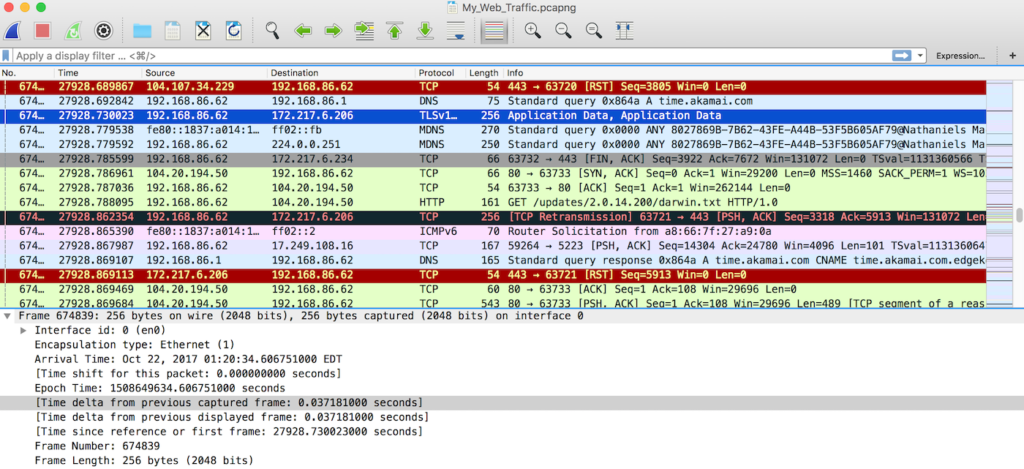
Here you can see more of the resets, packets with problems, and successful TCP packets. There is also an HTTP packet in there.

Of the 1123421 packets recorded by Wireshark, 4034 of them –or about .45 of my packets– were HTTP. .2% (2058) of these had my IP address as the destination. A bit less –1766– had my IP address as the source. It remains unclear where the remaining 210 packets came from.
All-in-all, 34.7% of packets were outbound, originating from my computer, or about 390324 packets. 63.6% (714729 packets) were inbound to my computer. The remaining 1.7% (18678 packets) came from other devices on my network including my Google Wifi router, my Roku, an HP printer, my Amazon Echo, Dropbox LAN sync, and a host of apple products (namely my girlfriend’s laptop and our cell phones).
My biggest takeaway from this project was that Wireshark is incredibly powerful and gives users the ability to see virtually all activity occurring on their network. I barely scratched the surface of the tools capabilities with my use of it and I hope to continue experimenting with and exploring it as I learn more about network layers and communications protocols. What I am particularly interested in is how a utility like Wireshark, or specifically the data it collects, can be used for practical purposes in projects and devices.
Update: my partner Sebastien and I used the node.js PCAP module to incorporate packet sniffing into a REST API that let users monitor for specific websites as queues for disabling their router!